Technical Analysis – Concepts, Tools, and Practice
Technical analysis organizes market information to aid decision-making. This guide covers foundational concepts (trends, structure), indicator categories, price action context, and how to build a practical toolkit with risk management. Educational only.
Table of Contents
- •Recommended Brokers
- •Introduction to Technical Analysis
- •Market Structure & Trends
- •Support & Resistance
- •Chart Patterns
- •Candlestick Patterns
- •Trend Indicators
- •Momentum Indicators
- •Volatility Indicators
- •Volume Indicators
- •Trading Strategies
- •Risk Management
- •Trading Psychology
- •Common Mistakes
- •Broker Comparison
- •Frequently Asked Questions
Introduction to Technical Analysis
Technical analysis is a method of evaluating financial markets by analyzing statistical trends gathered from trading activity, such as price movement and volume. Unlike fundamental analysis, which attempts to measure a security's intrinsic value, technical analysis focuses on patterns in price movements, trading signals, and various other analytical charting tools to evaluate a security's strength or weakness.
The core principle of technical analysis is that market psychology influences trading in predictable ways, and that these patterns can be identified and capitalized upon. Technical analysts believe that all current market information is already reflected in the price, so they study price movements to forecast future price direction.
Educational Note: Technical analysis is a skill that requires practice and continuous learning. Always test strategies on demo accounts before implementing them with real money.
Basic Principles of Technical Analysis
- Market Action Discounts Everything: All known information is already reflected in prices
- Prices Move in Trends: Prices tend to move in persistent directions rather than randomly
- History Tends to Repeat Itself: Market participants often react similarly to similar situations
- Focus on Probability: Technical analysis provides probabilistic outcomes, not certainties
Market Structure & Trends
Understanding market structure is fundamental to technical analysis. Market structure refers to the organization of price movements over time, which helps traders identify the current market condition and potential future movements.
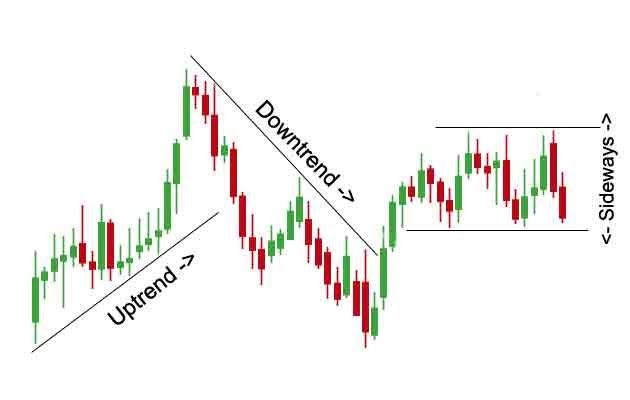
Types of Trends
Uptrend
Characterized by higher highs and higher lows. The overall direction is upward.
Downtrend
Characterized by lower highs and lower lows. The overall direction is downward.
Sideways/Ranging
Price moves within a horizontal range with no clear directional bias.
Trend Components
- Primary Trend: The long-term direction lasting several months to years
- Secondary Trend: Corrections within the primary trend lasting weeks to months
- Minor Trend: Short-term fluctuations lasting days to weeks
Practical Application:
Align your trading timeframe with the higher timeframe trend. For example, if the daily chart shows an uptrend, look for buying opportunities on the 4-hour or 1-hour charts during pullbacks.
Support & Resistance
Support and resistance are fundamental concepts in technical analysis that represent key price levels where buying or selling pressure is expected to emerge. These levels act as barriers that can prevent the price from moving in a certain direction.
Support Levels
Support is a price level where buying interest is sufficiently strong to overcome selling pressure. As the price approaches support, buyers become more inclined to buy and sellers become less inclined to sell. Support levels are typically identified below the current price.
Resistance Levels
Resistance is a price level where selling interest is sufficiently strong to overcome buying pressure. As the price approaches resistance, sellers become more inclined to sell and buyers become less inclined to buy. Resistance levels are typically identified above the current price.
Types of Support and Resistance
| Type | Description | How to Identify |
|---|---|---|
| Static S/R | Fixed price levels that remain constant over time | Previous highs/lows, round numbers |
| Dynamic S/R | Moving levels that change with price action | Moving averages, trendlines |
| Psychological S/R | Levels that have significance to market psychology | Round numbers (1.3000, 100.00) |
| Volume-based S/R | Levels where significant trading volume occurred | Volume profile, high volume nodes |
Trading Tip:
Support and resistance are better thought of as zones rather than exact lines. Price often reacts slightly before or after reaching these levels due to market anticipation.
Chart Patterns
Chart patterns are distinctive formations created by the price movements on a chart that signal potential future price movements. These patterns are classified into two main categories: continuation patterns and reversal patterns.
Reversal Patterns
Reversal patterns indicate that the current trend is likely to reverse. These patterns form at the end of a trend and signal a change in direction.
Head and Shoulders
A bearish reversal pattern consisting of three peaks, with the middle peak (head) being the highest and the two outside peaks (shoulders) being lower and roughly equal.
- Forms after an uptrend
- Neckline acts as key support
- Price target: distance from head to neckline projected downward from breakdown
Double Top/Bottom
A reversal pattern where price tests a support or resistance level twice before reversing.
- Double top is bearish (forms 'M' shape)
- Double bottom is bullish (forms 'W' shape)
- Confirmation occurs when neckline is broken
Continuation Patterns
Continuation patterns suggest that the current trend will resume after a period of consolidation. These patterns represent temporary pauses in the prevailing trend.
Triangles
Patterns formed by converging trendlines as price ranges narrow.
- Symmetrical: two converging trendlines with similar slopes
- Ascending: horizontal resistance, rising support
- Descending: horizontal support, falling resistance
Flags and Pennants
Short-term consolidation patterns that occur after sharp price movements.
- Flags: parallel trendlines in a small channel
- Pennants: small symmetrical triangles
- Typically last 1-3 weeks
Candlestick Patterns
Candlestick charts display the open, high, low, and close prices for a specific period. Candlestick patterns are formations that provide insights into market sentiment and potential price reversals or continuations.
Single Candlestick Patterns
| Pattern | Description | Signal |
|---|---|---|
| Doji | Open and close are virtually equal | Indecision, potential reversal |
| Hammer | Small body with long lower shadow | Bullish reversal (in downtrend) |
| Hanging Man | Small body with long lower shadow | Bearish reversal (in uptrend) |
| Shooting Star | Small body with long upper shadow | Bearish reversal (in uptrend) |
Multiple Candlestick Patterns
| Pattern | Description | Signal |
|---|---|---|
| Engulfing | Second candle completely engulfs the first | Strong reversal signal |
| Morning Star | Three-candle pattern: long bearish, doji/small, long bullish | Bullish reversal |
| Evening Star | Three-candle pattern: long bullish, doji/small, long bearish | Bearish reversal |
| Three White Soldiers | Three consecutive long bullish candles | Strong bullish continuation |
Important Note:
Candlestick patterns are more reliable when they form at key support/resistance levels or in conjunction with other technical indicators. Always consider the context in which the pattern forms.
Trend Indicators
Trend indicators are technical tools that help identify the direction and strength of a market trend. These indicators smooth out price data to create a composite line that traders can use to determine trend direction.
Moving Averages
Moving averages are among the most popular trend-following indicators. They calculate the average price over a specific period and plot it as a line on the chart.
Simple Moving Average (SMA)
Calculates the average price over a specified number of periods.
Formula: SMA = (Sum of Closing Prices) / Number of Periods
Usage: Identifies trend direction and potential support/resistance levels.
Exponential Moving Average (EMA)
Gives more weight to recent prices, making it more responsive to new information.
Formula: EMA = (Closing Price × Multiplier) + (Previous EMA × (1 - Multiplier))
Usage: Provides faster signals than SMA, popular for short-term trading.
Moving Average Crossovers
Moving average crossovers occur when two moving averages of different periods cross each other, generating buy or sell signals.
| Crossover Type | Description | Signal |
|---|---|---|
| Golden Cross | Short-term MA crosses above long-term MA | Bullish signal |
| Death Cross | Short-term MA crosses below long-term MA | Bearish signal |
Other Trend Indicators
ADX (Average Directional Index)
Measures trend strength regardless of direction. Values above 25 indicate a strong trend, while values below 20 suggest a weak trend or ranging market.
Ichimoku Cloud
A comprehensive indicator that shows support/resistance, trend direction, momentum, and trading signals in one view.
Momentum Indicators
Momentum indicators measure the rate of change in price movements, helping traders identify the strength behind price moves and potential reversal points.
RSI (Relative Strength Index)
RSI is a popular momentum oscillator that measures the speed and change of price movements on a scale of 0 to 100.
| RSI Level | Interpretation | Trading Signal |
|---|---|---|
| Above 70 | Overbought condition | Potential sell signal |
| Below 30 | Oversold condition | Potential buy signal |
| Between 30-70 | Neutral territory | No clear signal |
| Divergence | Price and RSI move in opposite directions | Strong reversal signal |
MACD (Moving Average Convergence Divergence)
MACD is a trend-following momentum indicator that shows the relationship between two moving averages of a security's price.
MACD Line
The difference between the 12-period and 26-period EMA.
Signal Line
The 9-period EMA of the MACD line.
Histogram
The difference between the MACD line and the signal line.
Stochastic Oscillator
The Stochastic Oscillator compares a closing price to its price range over a specific period, generating values between 0 and 100.
Trading Tip:
Momentum indicators work best in trending markets. In ranging markets, they can give false signals as prices oscillate between overbought and oversold levels without significant directional movement.
Volatility Indicators
Volatility indicators measure the rate of price fluctuations, helping traders understand the level of risk in the market and adjust their position sizing and stop-loss levels accordingly.
ATR (Average True Range)
ATR measures market volatility by decomposing the entire range of an asset price for that period. It was developed by J. Welles Wilder Jr. and is particularly useful for setting stop-loss orders.
ATR Calculation
True Range = Maximum of:
- Current High - Current Low
- Absolute Value (Current High - Previous Close)
- Absolute Value (Current Low - Previous Close)
ATR = Moving Average of True Range over a specified period (typically 14)
Bollinger Bands
Bollinger Bands consist of a middle band (simple moving average) and two outer bands that are standard deviations away from the middle band. The bands expand and contract based on market volatility.
| Band Position | Interpretation | Trading Signal |
|---|---|---|
| Price touches upper band | Potentially overbought | Possible sell signal |
| Price touches lower band | Potentially oversold | Possible buy signal |
| Bands squeeze (narrow) | Low volatility period | Potential breakout imminent |
| Bands expand | High volatility period | Trend continuation or reversal |
Other Volatility Indicators
Keltner Channel
Similar to Bollinger Bands but uses Average True Range for band width calculation instead of standard deviation.
Donchian Channel
Forms upper and lower bands based on the highest high and lowest low over a specified period.
Volume Indicators
Volume indicators measure the number of shares or contracts traded in a security or market during a given period. Volume is often used to confirm the strength of a price move.
On-Balance Volume (OBV)
OBV is a cumulative indicator that uses volume flow to predict changes in stock price. It adds volume on up days and subtracts volume on down days.
OBV Interpretation
- Rising OBV confirms uptrends
- Falling OBV confirms downtrends
- OBV divergence from price can signal potential reversals
Volume Price Trend (VPT)
VPT combines price and volume to determine the strength of money flowing in or out of a security. It similar to OBV but uses percentage price change instead of simple direction.
Money Flow Index (MFI)
MFI is a momentum indicator that incorporates both price and volume data. It is often called the volume-weighted RSI as it uses the same formula as RSI but includes volume.
| MFI Level | Interpretation | Trading Signal |
|---|---|---|
| Above 80 | Overbought condition | Potential sell signal |
| Below 20 | Oversold condition | Potential buy signal |
| Divergence | Price and MFI move in opposite directions | Strong reversal signal |
Volume Confirmation Principle:
Volume should confirm the price trend. In an uptrend, volume should increase on up days and decrease on down days. In a downtrend, volume should increase on down days and decrease on up days. If volume contradicts the price movement, it may signal a potential reversal.
Trading Strategies
A trading strategy is a fixed plan designed to achieve profitable returns by going long or short in markets. The main ingredients of a trading strategy are time frame, entry points, exit points, and money management.
Trend Following Strategies
Trend following strategies aim to capture gains through the analysis of an asset's momentum in a particular direction.
Moving Average Crossover Strategy
Setup:
- Use two moving averages: a fast MA (e.g., 20-period) and a slow MA (e.g., 50-period)
- Buy when the fast MA crosses above the slow MA
- Sell when the fast MA crosses below the slow MA
Risk Management:
- Place stop-loss below recent swing low (for long positions) or above recent swing high (for short positions)
- Use ATR to determine stop distance
- Target reward-to-risk ratio of at least 1:1
Mean Reversion Strategies
Mean reversion strategies are based on the concept that prices tend to revert to their historical mean or average over time.
Bollinger Bands Mean Reversion Strategy
Setup:
- Use Bollinger Bands with standard settings (20-period MA, 2 standard deviations)
- Buy when price touches or crosses below the lower band and RSI is below 30
- Sell when price touches or crosses above the upper band and RSI is above 70
Risk Management:
- Place stop-loss outside the opposite band
- Take profit at the middle band or opposite band
- Only trade in ranging markets, avoid during strong trends
Breakout Strategies
Breakout strategies involve entering a trade when the price moves outside a defined support or resistance level with increased volume.
Support/Resistance Breakout Strategy
Setup:
- Identify key support and resistance levels on higher timeframes
- Wait for price to break through these levels with conviction
- Enter on retest of broken level or on initial breakout with confirmation
Risk Management:
- Place stop-loss on the other side of the broken level
- Target next significant support/resistance level
- Use volume confirmation to validate the breakout
Important: No strategy guarantees profits. Always backtest strategies thoroughly and practice on demo accounts before trading with real money. Market conditions change, and strategies that work in one environment may fail in another.
Risk Management
Risk management is the process of identification, analysis, and acceptance or mitigation of uncertainty in investment decisions. Proper risk management is essential for long-term trading success.
Position Sizing
Position sizing determines how much capital to allocate to a single trade. Proper position sizing helps control risk and preserve capital.
| Method | Description | Formula |
|---|---|---|
| Fixed Percentage | Risk a fixed percentage of account per trade | Position Size = (Account Balance × Risk %) / (Entry - Stop Loss) |
| Fixed Dollar | Risk a fixed dollar amount per trade | Position Size = Fixed Dollar Risk / (Entry - Stop Loss) |
| Volatility-based | Adjust position size based on market volatility | Position Size = (Account Balance × Risk %) / (ATR × Multiplier) |
Stop-Loss Orders
A stop-loss order is designed to limit an investor's loss on a security position. Setting the stop-loss level is a critical component of risk management.
Fixed Percentage Stop
Place stop at a fixed percentage away from entry (e.g., 2% below entry for long positions).
Support/Resistance Stop
Place stop just below support (for long positions) or above resistance (for short positions).
ATR-based Stop
Place stop at a multiple of ATR away from entry (e.g., 2x ATR below entry for long positions).
Moving Average Stop
Place stop below a moving average (for long positions) or above a moving average (for short positions).
Risk-Reward Ratio
The risk-reward ratio measures the potential profit of a trade against its potential loss. A favorable risk-reward ratio is essential for long-term profitability.
Calculation: Risk-Reward Ratio = Potential Profit / Potential Loss
Example: If you risk $100 to make $300, your risk-reward ratio is 1:3.
General Guideline: Aim for a minimum risk-reward ratio of 1:1.5, with 1:2 or higher being preferable.
Risk Warning: Never risk more than you can afford to lose. The 1% rule (risking no more than 1% of your account per trade) is a common guideline among professional traders.
Trading Psychology
Trading psychology refers to the emotions and mental state that help or hinder decision-making in trading. Mastering trading psychology is often cited as one of the most challenging aspects of becoming a successful trader.
Common Psychological Biases
Confirmation Bias
Seeking information that confirms existing beliefs while ignoring contradictory evidence.
Overconfidence
Overestimating one's ability to predict market movements, often after a series of successful trades.
Loss Aversion
The tendency to prefer avoiding losses rather than acquiring equivalent gains.
Recency Bias
Giving more weight to recent events than historical data when making decisions.
Emotional Challenges in Trading
| Emotion | Impact | Management Strategy |
|---|---|---|
| Fear | Missing opportunities, exiting trades too early | Stick to predefined trading plan, use smaller position sizes |
| Greed | Overtrading, holding positions too long | Set profit targets, take partial profits |
| Hope | Holding losing positions, ignoring stop-losses | Always use stop-losses, accept losses as part of trading |
| Regret | Revenge trading, chasing missed opportunities | Focus on process not outcomes, maintain trading journal |
Developing a Trader's Mindset
- Discipline: Follow your trading plan consistently, even when emotions run high
- Patience: Wait for high-probability setups rather than forcing trades
- Objectivity: Base decisions on data and analysis, not emotions or hunches
- Resilience: Learn from losses without becoming discouraged
- Adaptability: Adjust strategies when market conditions change
Psychological Tip:
Maintain a trading journal that includes not only your trades but also your emotional state and thought process during each trade. Review this journal regularly to identify patterns in both your successful trades and your psychological challenges.
Common Technical Analysis Mistakes
Many traders, especially beginners, make common mistakes when applying technical analysis. Being aware of these pitfalls can help you avoid them and improve your trading performance.
Analysis Mistakes
Indicator Overload
Using too many indicators that provide conflicting signals, leading to analysis paralysis.
Solution: Focus on 2-3 complementary indicators that align with your trading strategy.
Ignoring Higher Timeframes
Making trading decisions based solely on lower timeframes without considering the broader context.
Solution: Always check the next higher timeframe to understand the overall trend and key levels.
Curve Fitting
Over-optimizing strategies based on past data, resulting in systems that fail in live markets.
Solution: Use out-of-sample testing and focus on robust strategies that work across different market conditions.
Ignoring Market Context
Applying the same techniques regardless of market conditions (trending vs. ranging).
Solution: Adapt your approach based on the current market regime.
Trading Implementation Mistakes
| Mistake | Consequence | Prevention |
|---|---|---|
| Moving Stops Further | Small losses turn into large losses | Set stops before entering and don't move them |
| Revenge Trading | Emotional trading after a loss, often leading to more losses | Take a break after a significant loss |
| Overtrading | Increased transaction costs, taking low-quality setups | Set daily/weekly trade limits |
| Failing to Take Profits | Winning trades turn into losers or breakeven trades | Set profit targets and use trailing stops |
Learning Opportunity: Every mistake is a learning opportunity. The key is to recognize mistakes quickly, learn from them, and avoid repeating them. Maintaining a detailed trading journal can help identify patterns in your mistakes.
Broker Comparison for Technical Analysis
Choosing the right broker is crucial for technical traders. The platform should offer robust charting tools, a wide range of indicators, and reliable execution. Below is a comparison of recommended brokers for technical analysis.
| Broker | Platform | Indicators | Charting Tools | Demo Account | Visit |
|---|---|---|---|---|---|
| Deriv | Deriv MT5, Deriv Trader | 50+ indicators | Advanced with custom timeframes | Yes | Main · Alt |
| HFM | MT4, MT5, HFM Platform | 60+ indicators | Professional with multiple timeframes | Yes | Visit |
| Exness | MT4, MT5, Exness Terminal | 55+ indicators | Advanced with pattern recognition | Yes | Visit |
| XM | MT4, MT5, XM Web Trader | 45+ indicators | Comprehensive with trading signals | Yes | Main · Alt |
| AvaTrade | MT4, MT5, AvaTradeGO | 60+ indicators | Advanced with automated trading | Yes | Visit |
Frequently Asked Questions
Which technical indicators are best for beginners?
For beginners, it's recommended to start with a simple set of indicators that cover different aspects of market analysis. A good starting combination includes:
- Moving Averages (MA): For trend identification (e.g., 20-period and 50-period EMA)
- Relative Strength Index (RSI): For momentum and overbought/oversold conditions
- Average True Range (ATR): For volatility measurement and stop-loss placement
As you gain experience, you can explore additional indicators that align with your trading style.
How do I avoid analysis paralysis from too many indicators?
Analysis paralysis occurs when traders use too many indicators that provide conflicting signals. To avoid this:
- Limit yourself to 2-4 complementary indicators
- Choose indicators from different categories (trend, momentum, volatility)
- Define clear rules for when indicators align and when they conflict
- Focus on price action and key support/resistance levels as your primary tools
- Remember that indicators are derived from price - they should confirm, not replace, price analysis
How reliable are chart patterns in technical analysis?
Chart patterns are probabilistic, not deterministic. Their reliability depends on several factors:
- Timeframe: Patterns on higher timeframes (daily, weekly) tend to be more reliable than those on lower timeframes
- Volume confirmation: Patterns accompanied by significant volume are more reliable
- Market context: Patterns that form at key support/resistance levels or align with the overall trend have higher success rates
- Pattern completion: Wait for the pattern to fully form and confirm before trading
No pattern works 100% of the time, so always use proper risk management.
Can technical analysis be used for all markets and timeframes?
Technical analysis principles can be applied to any market (stocks, forex, commodities, cryptocurrencies) and any timeframe, but their effectiveness may vary:
- Liquid markets: Technical analysis works best in highly liquid markets with minimal manipulation
- Timeframe considerations:
- Shorter timeframes (minutes/hours): More noise, faster signals, suitable for day trading
- Longer timeframes (days/weeks): Less noise, slower signals, suitable for position trading
- Market-specific adjustments: Some indicators or settings may need adjustment based on the characteristics of specific markets
How important is backtesting in technical analysis?
Backtesting is crucial for validating technical analysis strategies. It involves testing a trading strategy on historical data to see how it would have performed. Benefits include:
- Objective evaluation of strategy performance
- Identification of strategy weaknesses before risking real capital
- Optimization of parameters and rules
- Development of confidence in the strategy
However, remember that past performance doesn't guarantee future results. Always combine backtesting with forward testing on demo accounts.
What is the most common mistake beginner technical analysts make?
The most common mistake is overcomplication - using too many indicators, applying complex strategies without mastering the basics, and constantly changing approaches without giving any method enough time to work. Other common mistakes include:
- Ignoring risk management and position sizing
- Failing to account for trading costs (spreads, commissions)
- Chasing losses or becoming overconfident after wins
- Not adapting to changing market conditions
- Focusing on prediction rather than reaction to price action